North Korea: Comparing Guy Fawkes to 2004
Comparing this image of the effective explosive power to the site in North Korea yields some intersting conclusions. article
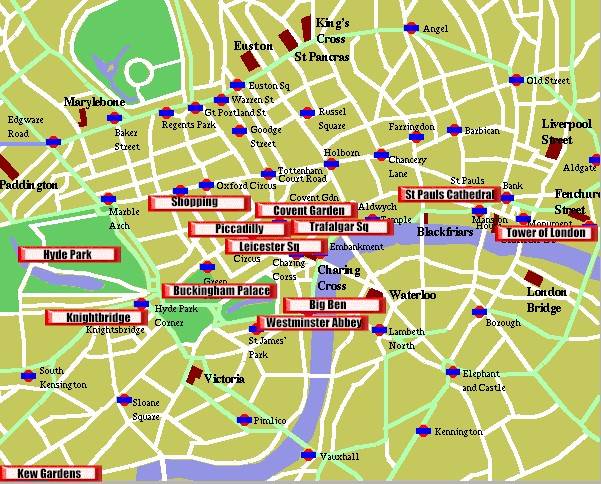
We could examine modern day London map, identify the equivalent distance, and then compare the "results" in the North Korean images.
Give we believe the minimum-required explosion is not consistent with the Richter scales, we would not be looking at the photographs for "confirmation of the North Korean story."
Rather, the goal would be to test the validity of the "minimum explosion of 75 Tons" and then comparing that "equivalent detonation" to what happened in London; and then compare the results to what we physically see in North Korean.
Identify a modern day equivalent to the 1600 explosion
Use non-standard conversion factors available during the era.
Convert the radius of the explosion into an effective area: A = P R2
Compare the size of trucks and dam-construction-equipment in other dam-photos.
Summarize The above exercise has nothing to do withthe real problem: 2.6 Richter reading where the hypothersized rail-car exploded during refueling. This is exactly the objective of the North Koreans: Divert resources from the real problem.
Here we go
Let's plow through this.
A. Let's get some coordinates off a modern day London Map. Then we'll pick some points around the circumference of the Guy Fawkes explosion to estimate the radios.
Here is the Guy Fawkes map; and let's take a look at the London Maps for distances.
B. We'll eye-ball it, and also do some "internet-distance caluclations" which will be "not as the crow flies" but merely to ensure "the eye-balled distances are reasonable."
C. Then we'll take an average of the disatances, and then check to verify the "final approved radius" matches what we might otherwise expect.
D. Then the next part is to go through the old-diaries of both Guy Fawkes, and then compare these sizes to other measurements of the era in the Colonial times. This will give us an idea of the physiical size and tonnage of the explosive power; we'll have to make sure we convert from barrels to pounds and tons so that our measurments are consistent with the Richter-scale charts for equivalent TNT.
Ref for the discussion on Colonial-era barrels; and article discussiong the conversion.
Notice that we're redoing some of the work in order to partially validate the Guy Fawkes analysis. If there's someting unusual, we'll dig more and do a more thorough analysis and indepdently recalculate the details: Energy, explosive impact.
However, the neat thing about the Guy Fawkes analysis is that we can, for the sake of checking, assuming that some of the numbers are right, and then use the common equaations available [area of circle, etc] to validate our assumptions about the radius are correct.
In other words, we're using the end results of someon else's analysis to do a cross check on our assumptions, and using the "known equations" to validate that our assumptions are reasonable. Again, if there's a disconnect, this will come out when we do the calculatoins in reverse. Usually, at this point one's mind will melt, so don't be afraid to find some ice to solidify it again.
F. The fun part starts when we explore the recent photos from Korea. The problem we immediatley have is that the photos are not dated; let's assume they are taken after the explosion. However, the other problem we have is that we have no comparison picture. So, one approach is simply to "hunt around" for an equivalent hole that would match what we might guess would be there based on Guy Fawkes-analssis.
Consider our existing links at Here, and Here.
The next step will be to do another search of the net to verify whether there are other images, video, and other analysis on sizing.
G. Again, because we have no "before and after" comparison, we're at a loss. Possibly somone later might be able to provide this photograph. Thanks.
H. Another point of comparison are other Dams, and compare "what is going on" at a particular phase of the dam-making to see if there, is in fact, a reasonable basis to "have this much dirt."
I. Also, we'll need to go back over our original questions from the initial assessments. This basically means going back through the green boxes, and reviewing the questions and issues that were raised.
Version 1.0; Version 2.o
J. Another problme we have in "not having a before and after photo" is that we don't know what got moved in terms of dirt. But what we do know is that we can compare the images of other dams, to see "what kind of activity is going on" and also compare the identificiable equipment in the Korean photos to standard measurments of those construction units.
Iceland
K. Again, not having a "before and after" photo will cause a problem; but we can at least get a sense of the "amount of size of the holes", and then compare the "size of holes" that we might expect based on the Guy Fawkes analysis.
L. If the North Koreans have fabricated these numbers, then after some careful analysis it should be readily apparent that "there is no hole" that would be at least 75 Tons of Gunpowder anywhere.
posted by Constant @ 2:34 PM
![]()
![]()


<< Home